
Right now, the stock market is practically in a state of euphoria.
The Nasdaq Composite is up a whopping 36% this year, and the Dow Industrials are within just 600 points of its all time high close.
Much of this is due to one of the best November rallies on record.
Individual investors are now extremely bullish as indicated by the AAII sentiment index, reversing a state of extreme bearishness in just a month.
I see lots of technical analysts, who don’t pay any attention to fundamentals, patting themselves on the back, as they follow price alone, and they’ve been making some money on some big name stocks.
Yet, the red flags are everywhere.
What has caught my attention in recent days is a big rally in Gold. You would think that if inflation was being tamed, this would not be the case.
But, Gold is rallying because it believes the Fed WILL be cutting rates sooner rather than later.
These rate cuts have nothing to do with inflation going down, but will have everything to do with an economy that is collapsing.
I say this because the market action is eerily similar to 2007, and this is confirming under reported economic data that has been coming out since September.
First, let’s have a look at the Gold futures in 2006-2007.

In 2006, Gold was rallying as it was clear monetary conditions were too easy. At the time, we had a massive bubble in the housing market.
The Fed had started hiking rates in 2004 when the effective Fed Funds rate was 1%. The rate hikes peaked in June 2006, about a month after the price of Gold peaked after a massive rally.
Fast forward to the current time frame…

In 2019, Gold rallied as the Fed reversed its 2018 tightening and started to lower rates. Then the Pandemic hit, and the money printing began, which drove Gold to marginal new all-time highs.
As inflation took hold in 2021, Gold didn’t budge, and it wasn’t until the Fed started to hike rates that Gold managed a brief rally in 2022, before dropping back.
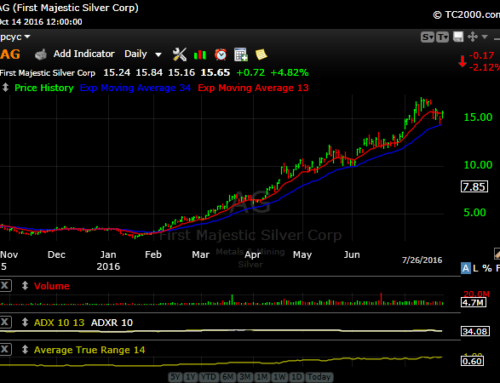
Since bottoming in late 2022, Gold has been in a choppy, but persistent uptrend, and as of late, this has become more pronounced. As I write this evening, Gold is up over $50.
Let’s now take a look at the relationship between the 10 Year Treasury Note and stocks.
First, let me point out that in late 2005, the yield curve as measured by the yield of the 2 year note and the 10 year note, became inverted.
What this generally means is that investors in treasuries suspect economic weakness to come, so they make a bet that yields on the long end will fall. This drives the long term yields below the short term yields.
As mentioned, the yield curve inverted in late 2005, but most investors dismissed the warning sign as a result of a global savings glut that was driving up asset prices, and driving yields downward.
The yield curve remained inverted well into 2007, when the Fed finally started to cut rates.


This chart is the S&P 500 futures in black and the 10 Year Treasury Note price in red.
In June 2007 we started getting wind of some underlying financial issues involving the subprime mortgage market when Bear Stearns forced to bail out one of its funds.
The initial reaction by both the stock market and treasuries was muted. However, a few weeks later, Bear Stearns revealed that its two subprime hedge funds had lost nearly all of their value.
This sparked a pretty quick drop in the stock market, and the Treasuries began to rally in earnest.
However, the market re-gained its footing and began to rally again heading into September.
And then, then, on September 18, the Fed cut rates by 50 basis points. Initially, this sparked a rally in stocks to a new all-time high before they reversed in October.
The Fed cut rates again at their late October 2007 meeting, indicating fears of an economic slowdown. Notice that the 10 Year Treasury Note continued to rally throughout, and continued to do so well into 2008.
The National Bureau of Economic Research indicates that the recession that followed began in December 2007. That recession lasted for 18 months and the S&P 500 declined by over 50%.
Fast forward to the current time frame.
First, the Yield Curve inverted briefly in early 2022, and then inverted again in for good in mid-2022. The inversion has been as much as about 100 basis points.
In 2022 we had a couple negative quarters of GDP. The most recent quarter showed a reading of 5.2%, which is one big reason for the current stock market rally along with market expectations of rate cuts next year due to a declining inflation rate. I’ll get to that in a minute.
Let’s look at the chart first.

The stock market, again indicated by the black line, has had a nice rally off the October 2022 lows (I should interject here that the Russell 2000 has not performed anywhere near this well), and since late October, has rallied sharply.
Meanwhile, the 10 Year Treasury Note made a fresh new low in October (corresponding to a yield of right around 5%), and has rallied sharply since.
This current rally is similar to that June 2007 rally in the 10 Year Note after the Bear Stearns initial news.
So what happened earlier this year similar to Bear Stearns?
The collapse of Silicon Valley Bank. This event occurred in March 2023 as a result of losses due to the Fed rate hikes and a downturn in growth in the tech industry.
The 10 Year Note briefly rallied on the news in a flight to quality, but the downtrend resumed until its recent low in October.
The question is, what sparked the current rally in the 10 Year Note? Why are yields on the long end dropping when we just had a 5.2% GDP print, and the jobs market is reportedly so tight?
Beneath the surface we’ve had weak economic data since late September.
source: tradingeconomics.com
This chart is continuing jobless claims. It represents the number of people who are continuing to file for benefits for four weeks or more, because they can’t find a new job.
This is the highest figure in two years, and it has been rising rapidly since late September.
In November, the ISM reading on manufacturing came in at 46.7, and it has been below 50 for all of 2023. Readings below 50 indicate activity is slowing.
The last bit of economic data I will add for now is that crude oil prices are down nearly $20 per barrel since late September.
This is in the face of OPEC supply cuts in an effort to boost prices, and an actual war in the Middle East between Israel and Hamas.
Why are oil prices down? A massive decline in demand.
Final Thoughts
Keep this one thing in mind… the Fed’s primary policy mandate is to keep inflation at a reasonable level. It failed at this in 2021-2022 when the official inflation rate spiked to over 9%.
It does not want to make this mistake again.
Jerome Powell understands that a big mistake made in the 1970’s was not staying ahead of inflation, and cutting rates too soon. It took the stones of Paul Volker to hike rates to 20% to get inflation under control, which caused a deep recession into 1982.
The population has an inflation psychology now. That won’t go away unless people stop spending. People won’t stop spending until they don’t have jobs.
So far, the unemployment rate is still low.
With that said, the unemployment rate probably needs to double from here to get inflation completely under control.
That would equate to a significant recession.
If the Fed hikes rates, it’s because the economy is in trouble, NOT because inflation is declining.

Leave A Comment